A bivariate frequency distribution will then be defined by the entire set of cell frequencies. A bivariate frequency distribution, in other words, is the frequency distribution of two variables. Bivariate data (Bi means “two” and “variate” means “variable”) is a term that represents data that is made up of observations that have two attributes or characteristics (2 variables). To put it another way, bivariate distribution looks at two variables.
The distribution formed when the data set is classified (summarized or grouped in the form of a frequency distribution) on the basis of two variables is known as a bivariate frequency distribution.
Bivariate frequency distribution
The distribution is known as a bivariate frequency distribution when the data is classified based on two variables. Its goal is to figure out how the two variables are related empirically. . Another name for it is two-way frequency distribution.
Frequency distribution
A frequency distribution is a graphical or tabular representation that shows the number of observations within a specified interval. The interval size is determined by the data being analysed and the analyst’s objectives.
Frequency Distribution Types
- cumulative frequency distribution
- Relative frequency distribution.
- Relative cumulative frequency distribution.
Importance of Frequency Distribution
The distribution is known as a bivariate frequency distribution when the data is classified based on two variables. Its goal is to figure out how the two variables are related empirically. Two-way frequency distribution is another name for it. Normal distributions, which show the observations of probabilities divided among standard deviations, benefit from frequency distributions in particular. Traders use frequency distributions to track price action and spot trends in finance.
How to calculate Bivariate Frequency distribution
The frequency distribution of a single variable is referred to as a univariate distribution. A two-way table can be used to summarise a data set that contains a large number of observations. Two variables, say X and Y, are associated with a two-way table. A number of classes can be defined for each variable, with the same considerations as in the univariate case.
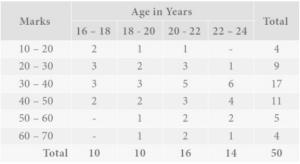
There will be m n cells in the two-way table when there are m n classes for X and n classes for Y. In a two-way table, the classes of one variable can be arranged horizontally and the classes of another variable can be arranged vertically. We can find the frequency for each cell by going through the pairs of X and Y values. A bivariate frequency distribution will then be defined by the entire set of cell frequencies. A bivariate frequency distribution, in other words, is the frequency distribution of two variables.

Table 1: BIvariate frequency distribution of age & marks
The frequency distribution of two variables, age and marks, obtained by 50 students in an skilful test, is shown. The marks classes are arranged horizontally (rows), while the age classes are arranged vertically (columns). The frequency of the corresponding row and column values is displayed in each cell. For example, there are five students in the class of 20 – 22 years old with grades in the 30 – 40 range.
Conclusion
A distribution that depicts the frequency of each possible combination of two categorical variables. A bivariate frequency distribution, for example, can be used to show how many male and female students at a university are majoring in different fields of study. In statistics, it is vastly important. A well-structured frequency distribution also allows for a detailed analysis of the population’s structure in relation to specific characteristics.
 Profile
 Settings
 Refer your friends
 Sign out


