Access free live classes and tests on the app
Download
+
Unacademy
  • Goals
    • AFCAT
    • AP EAMCET
    • Bank Exam
    • BPSC
    • CA Foundation
    • CAPF
    • CAT
    • CBSE Class 11
    • CBSE Class 12
    • CDS
    • CLAT
    • CSIR UGC
    • GATE
    • IIT JAM
    • JEE
    • Karnataka CET
    • Karnataka PSC
    • Kerala PSC
    • MHT CET
    • MPPSC
    • NDA
    • NEET PG
    • NEET UG
    • NTA UGC
    • Railway Exam
    • SSC
    • TS EAMCET
    • UPSC
    • WBPSC
    • CFA
Login Join for Free
avtar
  • ProfileProfile
  • Settings Settings
  • Refer your friendsRefer your friends
  • Sign outSign out
  • Terms & conditions
  • •
  • Privacy policy
  • About
  • •
  • Careers
  • •
  • Blog

© 2023 Sorting Hat Technologies Pvt Ltd

  • CAT 2023
  • Study Materials
  • Notifications
  • CAT Syllabus
  • CAT Mock Test
  • CAT Exam Pattern
  • CAT Question Paper
  • CAT Preparation Books
  • Downloads
  • Important Formulas
  • Eligibility Criteria
CAT 2025 » CAT Study Material » Data Interpretation and Logical Reasoning » Venn Diagram Questions
scholarship_cat

Venn Diagram Questions

In this lecture we’re going to learn about venn diagram questions,venn diagram formula and venn diagram problems.

Table of Content
  •  

A Venn diagram is a graphic that employs circles to represent relationships between objects or finite groups of objects. Circles that overlap share qualities, whereas circles that do not overlap do not.

Venn diagrams are used to understand the similarities and differences between two concepts visually. They’ve long been acknowledged for their educational value. Venn diagrams have been utilised in introductory logic curriculum and elementary-level educational plans all across the world since the mid-20th century.

Application

Venn diagrams are used to show how elements relate to one another against a backdrop, universe, data set, or environment. For example, a Venn diagram may be used to compare two companies in the same industry by demonstrating the products that both companies offer (where circles overlap) as well as the products that are distinctive to each company (outer circles).

Venn diagrams are basic graphical representations of the relationship between two groups of objects. They can, however, be far more complicated. Despite this, the Venn diagram’s streamlined aim of illustrating concepts and groups has led to its widespread use in a variety of sectors, including statistics, linguistics, logic, education, computer science, and commerce.

Formulas

Some important formulas for two and three elements in the Venn Diagram.

n ( A ∪ B) = n(A ) + n ( B ) – n ( A∩ B)

n (A ∪ B ∪ C) = n(A ) + n ( B ) + n (C) – n ( A ∩ B) – n ( B ∩ C)

 – n ( C ∩ A) + n (A ∩ B ∩ C)

where n( A) = number of elements in set A.

Questions

1)In a college, 200 students are chosen at random. 140 people enjoy tea, 120 people enjoy coffee, and 80 people enjoy both tea and coffee.

How many students are only interested in tea?

How many people are solely coffee drinkers?

How many students don’t care for either tea or coffee?

How many students are content with just one cup of tea or coffee?

How many of the people enjoy at least one of the drinks?

Solution:

The following Venn diagram can be used to represent the supplied information, where T represents for tea and C for coffee.

The number of students who solely drink tea is 60.

There are 40 students that solely drink coffee.

There are 20 students that do not like tea or coffee.

60 + 40 = 100 students like only one type of tea or coffee.

Number of students that enjoy tea or coffee = n (just tea) + n (only coffee) + n (both tea and coffee) = 60 + 40 + 80 = 180

2. A survey of 500 college students indicated that 49 percent of them enjoyed watching football, 53 percent like hockey, and 62 percent enjoyed basketball.Furthermore, 27 percent like both football and hockey, 29 percent enjoyed both basketball and hockey, and 28 percent enjoyed both football and basketball. None of these games appealed to 5% of the population.

IMG_256

How many students enjoy watching all three games at the same time?

Calculate the proportion of students who prefer to watch only football versus those who prefer only hockey.

Calculate the number of students who prefer to watch only one of the three games.

Determine how many students enjoy watching at least two of the games.

Solution: n(F) = fraction of students who enjoy watching football = 49%

n(H) = number of students who enjoy watching hockey = 53%

n(B) = 62 percent of students who enjoy watching basketball.

(F H) = 27%; (B H) = 29%; (F B) = 28%

Because 5% of people prefer not to watch any of the games, n (F H B) = 95%.

95 percent = 49 percent + 53 percent + 62 percent -27 percent – 29 percent – 28 percent + n (F H B) Solving gives n (F H B) = 15 percent.

Create a Venn diagram using the values provided.The Venn diagram’s values are all in percentages.

Adding all three games equals 15% of 500 = 75.

The ratio of pupils who only like football to those who only like hockey is (9 percent of 500)/(12 percent of 500) = 9/12 = 3:4.

The total number of students who choose to watch only one of the three games is 205 (9 percent + 12 percent + 20 percent).

(number of students who enjoy watching only two of the games) + (number of students who enjoy watching all three games)= (12 + 13 + 14 + 15) percent, or 54 percent of 500 = 270.

Conclusion

Using visual tools to solve Venn Diagram questions makes it simple. Distinct sections can be shaded or marked to represent different groups or sets. However, it is important to emphasise that the existence or absence of any relationship between the supplied quantities should be properly marked.

faq

Frequently asked questions

Get answers to the most common queries related to the CAT Examination Preparation.

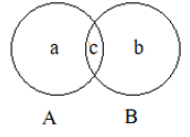
f n(A)=10, n(B)=20, c=5 in the given Venn diagram. Find a and b.

...Read full

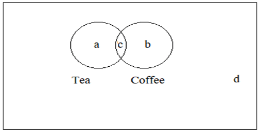
In a population of 100 persons, 40 persons like tea and 30 persons like coffee. 10 persons like both of them. How many persons don't like tea or coffee?

...Read full

In a population of 100 persons, 40 persons like tea and 30 persons like coffee. 10 persons like both of them. How many persons like only tea?

...Read full

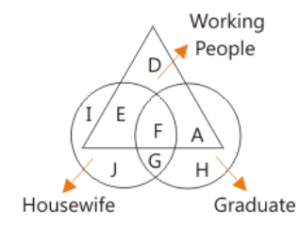
Who among the following is Graduate and Housewife but not among Working People ?

...Read full

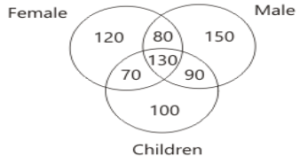
The diagram shows the survey on sample of 500 persons with reference to the number of males, females and children. which of the following groups of person represented by 90?

...Read full

Ans. From the given diagram, a + c = 10 => a+5=10 => a=5

and b + c = 20 => b+5=20 => b=15

Ans. Given, a + b + c + d = 100, a + c = 40, b + c = 30, c = 10

b+10=30 => b=20

a + b + c = 40+20 = 60

d+60=100 => d=40 i.e. 40 persons  are there who don’t like tea or coffee.

Ans. Given, a + b + c + d = 100, a + c = 40, b + c = 30, c = 10

a+10=40 => a=30 i.e. 30 persons like only tea.

Ans. G appears in the overlapping area of the circles of’ Graduates’ and’ Housewives,’ but not in the triangle of’ Working persons,’ as seen in the Venn diagram.It can be seen that G is a Graduate and it’s one of the housewives but not one of the working people.

Ans. 90 is the number of persons who are both males and children.

Crack CAT with Unacademy

Get subscription and access unlimited live and recorded courses from India’s best educators

  • Structured syllabus
  • Daily live classes
  • Ask doubts
  • Tests & practice
Learn more

Notifications

Get all the important information related to the CAT Exam including the process of application, important calendar dates, eligibility criteria, exam centers etc.

CAT Eligibility Criteria 2023
CAT Exam Pattern 2023
CAT Result 2022
CAT Syllabus 2023 – CAT Exam Syllabus – Download Latest PDF
IBSAT 2022 Notification
IIFT Notification
MAH CET Notification
MICAT Notification
NMAT Notification
SNAP Notification
TISSNET Notification
Top Colleges in India That Accept CAT Score
XAT Notification
See all

Related articles

Learn more topics related to Data Interpretation and Logical Reasoning
Wilson Remainder Theorem

To reduce huge numbers with regard to a certain modulus and to solve congruences, Wilson's theorem and Fermat's theorem can be employed.

Why Use the Critical Path Method

A brief note on Why use the critical path method, Improves future planning, Facilitates more effective resource management, Helps avoid bottlenecks and many things.

What is Types of Analogy Reasoning

In this lecture we’re going to learn about types of analogy reasoning, the number based/numerical analogy, letter and number based analogy and general knowledge-based analogy, questions based on analogy and many more things.

What is Posterior Probability

A posterior probability, in Bayesian records, is the revised or updated probability of an event happening after taking into account new records. The posterior probability is calculated by updating the prior probability by using Bayes’ theorem. In statistical phrases, the posterior probability is the probability of event A taking place given that event B has taken place.

See all
Access more than

469+ courses for CAT – Optional

Get subscription

Trending Topics

  • CAT Mock Test
  • CAT Question Papers
  • CAT 2021 Question Paper
  • CAT 2020 Question Paper
  • CAT Question Paper 2019 PDF
  • Best Books for CAT Preparation
  • CAT Eligibility Criteria
  • CAT Syllabus
  • CAT Exam Pattern
  • CAT Result
combat_cat

Related links

  • Co-ordinate Geometry applications
  • What Is A Polygon?
  • Uses of a Quadrilateral
  • Algebraic Identities
  • SPSS Full Form
  • Geometric Progression’s Uses
  • Blood Relation Questions
freeliveclasses_cat
CAT 2024 Question Paper
.
Company Logo

Unacademy is India’s largest online learning platform. Download our apps to start learning


Starting your preparation?

Call us and we will answer all your questions about learning on Unacademy

Call +91 8585858585

Company
About usShikshodayaCareers
we're hiring
BlogsPrivacy PolicyTerms and Conditions
Help & support
User GuidelinesSite MapRefund PolicyTakedown PolicyGrievance Redressal
Products
Learner appLearner appEducator appEducator appParent appParent app
Popular goals
IIT JEEUPSCSSCCSIR UGC NETNEET UG
Trending exams
GATECATCANTA UGC NETBank Exams
Study material
UPSC Study MaterialNEET UG Study MaterialCA Foundation Study MaterialJEE Study MaterialSSC Study Material

© 2025 Sorting Hat Technologies Pvt Ltd

Unacademy
  • Goals
    • AFCAT
    • AP EAMCET
    • Bank Exam
    • BPSC
    • CA Foundation
    • CAPF
    • CAT
    • CBSE Class 11
    • CBSE Class 12
    • CDS
    • CLAT
    • CSIR UGC
    • GATE
    • IIT JAM
    • JEE
    • Karnataka CET
    • Karnataka PSC
    • Kerala PSC
    • MHT CET
    • MPPSC
    • NDA
    • NEET PG
    • NEET UG
    • NTA UGC
    • Railway Exam
    • SSC
    • TS EAMCET
    • UPSC
    • WBPSC
    • CFA

Share via

COPY