Profile
 Settings
 Refer your friends
 Sign out


A Venn diagram shows the similarities and contrasts between objects or groups of things by using circles that overlap or don’t overlap. Those with commonality are represented by overlapping circles, whereas things that are distinct are represented by separate circles. Venn diagrams are increasingly widely utilised in industry and academia as examples.
The Venn Diagram
Venn diagrams are used to depict the similarities and differences between two concepts visually. They’ve long been acknowledged as valuable instructional resources. Venn diagrams have been employed in introductory logic curriculum and elementary-level instructional plans around the world since the mid-20th century.
In the 1880s, English logician John Venn popularised the graphic. After the Swiss mathematician Leonard Euler, who produced similar diagrams in the 1700s, he named them Eulerian circles.
In his book “A Survey of Symbolic Logic,” published in 1918, Clarence Lewis, an American academic philosopher and the ultimate father of conceptual pragmatism, referred to the circular portrayal as the Venn diagram. Since the mid-twentieth century, Venn diagrams have been used in schools ranging from elementary school to introductory reasoning. Venn created his way of utilising diagrams to demonstrate the subject of mathematics known as set theory while studying and teaching logic and probability theory at Cambridge University.
“The Logic of Chance,” a groundbreaking study by Venn, described the frequency theory of probability. He maintained that, contrary to popular belief, probability should be determined by the regularity with which something is projected to occur. Venn drew on and developed mathematician George Boole’s algebra theories in another book, Symbolic Logic. This effort aided in the creation of the Venn diagram.
DETAILED VERSION OF VENN DIAGRAM
Venn Diagrams are diagrams that are used to represent relationships between sets.
Rectangles and closed curves, mainly circles but also ellipses, make up the Venn Diagram. A rectangle is used to symbolise the universal set, and circles or ellipses are used to indicate its subsets.
The constituents of sets are typically written in their respective circles in Venn Diagrams.
U=1,2,3,…10 is the universal set, while A=2,4,6,8,10 is a subset of it.
Venn Diagram can be used to execute a variety of operations on sets, including:
Any two sets can be A and B. The set consisting of all the elements of A and all the elements of B, the common elements being taken only once, is known as the union of A and B. The union is represented by the letter U.
We write AB symbolically and read it as A union B.
Let A=4,6,8 and B=6,8,10,12,13,17 as an example. We have A and B. A∪B={4,6,8,10,12,13,17}
While writing AB, the common elements 6 and 8 were only used once.
Some Union Operation Properties
- (A∪B)=(B∩A) (Commutative law)
- (A∪B)∪C=A∪(B∪C) (Associative law)
- (A)=(A),(UA)=(U) (Law of and U)
- (A∪A)=A (Idempotent law)
Sets that intersect
The set of all elements that are common to both A and B is the intersection of sets A and B. The intersection is represented by the symbol. The set containing all elements that belong to both A and B is the intersection of two sets of two sets A and B. We write AB=x:xAandxB symbolically.
Let A=2,4,6,8 and B=6,8,10,12 be two examples. Find A∩B We can see that 6,8 are the only elements that both A and B have in common. Hence, A∩B={6,8}
Some properties of intersection operations:
- A∩B=(B∩A) (Commutative law)
- (A∩B)∩C=A∩(B∩C) (Associative law)
- (A)=(UA)=(A) (Law of and U)
- (A∩A)=A (Idempotent law)
- A∩(B∪C)=(A∩B)∪(B∩C) (Distributive law)
Set Complement: Let be the universal set, and A be a subset of it. The complement of A is then the set of all elements that aren’t elements of A.
We use A′ to indicate the complement of A with regard to U symbolically.
Thus, \sA′={x:x∈Uandx∉A}. Clearly, A′=U–A.
We know that a set A’s complement can also be thought of as the difference between a universal set U and set A.
Let U=1,2.3,4,5,6,7,8,9,10 and A=1,3,5,7,9 be the values of A′.
We can see from the data that the members of U that do not belong to set A are 2,4,6,8,10.
So, A′={2,4,6,8,10}
Venn Diagrams Have Many Uses
Venn diagrams are used to show how elements interact with one another against a background, universe, data set, or environment. For example, a Venn diagram may be used to compare two companies in the same industry by showing the items that both companies offer (where circles overlap) and the products that are unique to each company (outer circles).
Venn diagrams are simple pictorial representations of the relationship that exists between two groups of things at their most fundamental level. They can, however, be far more complicated.
Venn Diagrams Examples
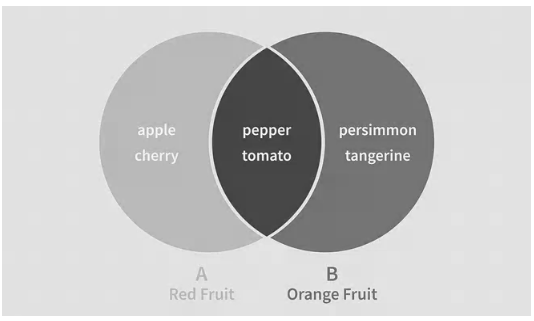
Fruits that are red or orange in hue could be represented by a Venn diagram. Below, we can observe that persimmons and tangerines are orange fruits (circle B), but apples and cherries (circle A) are red. The overlapping portion of the two circles represents the red and orange colours of peppers and tomatoes.
You may also use a Venn diagram to help you choose between two autos. The Venn diagram depicts the qualities that are unique to each car as well as those that are shared by both.
We can see that Car A is a gasoline-powered sedan that gets 20 miles per gallon, whereas Car B is a hybrid that gets 40 miles per gallon and is a hatchback.
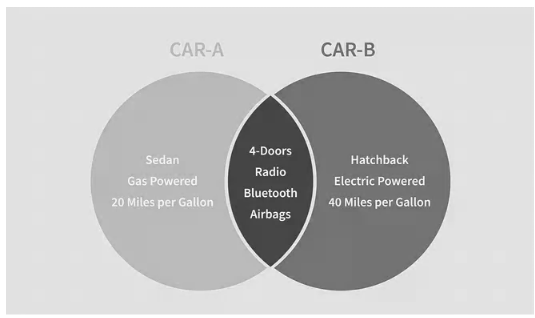
The shaded zone where the two circles intersect depicts the amenities that both automobiles share, such as a radio, four doors, Bluetooth capabilities, and airbags.
The Venn diagram depicts the similarities and contrasts between the two cars to aid in the decision-making process.
CONCLUSION
Venn diagrams are visual representations of mathematical set theory principles. They highlight logical links between distinct groupings of sets using Venn diagram symbols. Nonetheless, the Venn diagram’s streamlined aim of illustrating concepts and groups has led to its widespread use in a variety of sectors, including statistics, linguistics, logic, education, computer science, and commerce.