Profile
 Settings
 Refer your friends
 Sign out


A line graph is a graphical representation of changes over a period of time. In a line graph, the horizontal axis is the x-axis, and the vertical axis is the y-axis.
Definition of Line Graph
A line graph is a sort of graph or chart that displays data that varies over time. A line graph is created by connecting numerous points using straight lines.
Line Graph Example
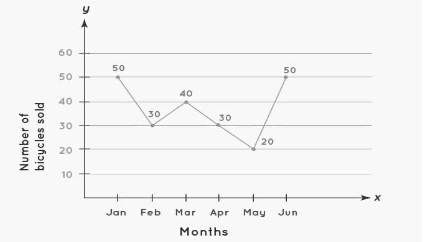
The accompanying line graph depicts the sale of bicycles by a bicycle firm from January to June. The time period is represented by the x-axis, while the quantity of bicycles sold each month is represented by the y-axis. A data point is represented by a dark point on the graph. On a line graph, a data point represents the quantity or number that corresponds to a specific period on the x-axis. In this example, 50 bicycles were sold in the month of January. In the same way, 30 bicycles were sold in February. We can interpret this data for each month by using the data point.The line segment that connects these individual data points shows whether bicycle sales are increasing or decreasing.
Different Types of Line Graphs
Simple Line Graph
A simple line graph is a type of graph in which only one line is drawn. Only one line is placed on the graph in the graphic above to show the link between the two variables. One of these variables is usually independent, while the other is a dependent variable.
Multiple Line Graph
A multiple line graph is a line graph that contains two or more lines. In a multiple line graph, more than one line is plotted on the same set of axes.It can be used to represent two or more variables that change at the same time.
The independent variable is plotted on the horizontal axis (the x-axis), while the dependent variables are plotted on the vertical axis (the y-axis). A multiple line graph is a useful tool for comparing comparable items across time.
Compound Line Graph
When information can be separated into different types, this sort of chart or line graph is used. To show the component part of a total, lines are drawn. The top line depicts the total, while the bottom line depicts a percentage of it. The size of each component is determined by the distance between each pair of lines.
Vertical Line Graph
Vertical line graphs are those in which each data point is connected to the horizontal axis by a vertical line. The line that depicts the variation is parallel to the y-axis and perpendicular to the x-axis in this style of graph. It denotes that the quantity on the x-axis remains constant while the quantity on the y-axis changes.
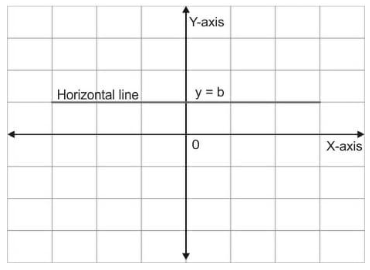
Horizontal Line Graph
Horizontal line graphs, as the name implies, are graphs in which a horizontal line runs parallel to the surface from each data point. These lines depict variance that is perpendicular to the y-axis and parallel to the x-axis. When the quantity on the y-axis does not change, the variation of the quantity is expressed on the x-axis.
Straight Line Graph
Straight-line graphs or linear graphs are line graphs in which the variation of any two numbers/quantities is expressed by a straight line. This form of line graph is used to handle problems with changing conditions throughout time. The pattern of a general linear function is y = mx + c, where m and c are constants.
Double Line Graph
A graph with two lines is known as a double line graph. A double line graph is used to compare trends and patterns between two items by showing how elements change over time.
Tips to Solve Line Graph Categories
- Reading a line graph is simple and may be learned by reading the points that connect the lines.
- Examine the horizontal (X-axis) and vertical (Y-axis) axes in detail, attempting to understand and relate the data to what these axes represent.
- Then study the values of the points highlighted in the intersection of the X-axis and the Y-axis, which are linked to produce the graph’s lines.
- Follow and examine the lines to see if there is any sort of rise or fall in the time interval. Look for rising and falling patterns that repeat themselves, as well as intersecting lines. We shall learn the details of the line graph in this manner.
- To interpret a multiple line graph, repeat the method for each line to examine various quantities that will be distinguished by different colours or types of lines.
- Emerging patterns may appear, which will aid you in predicting the trend.
Conclusion
A line graph is a form of graph in which data points are connected by line segments. One of the most prevalent types of charts is the line graph. They’re especially effective for things like demonstrating changes over time or other variables.