CAT 2023 » CAT Study Material » Data Interpretation and Logical Reasoning » Table Reasoning Questions And Answers

Table Reasoning Questions And Answers

In this lecture we’re going to learn about Table Reasoning Questions And Answers,table reasoning questions with answers,how to solve round table reasoning questions and reasoning table.

A table chart is a set of data that is organised in rows and columns and is one of the most common ways to communicate information to others. A table is made up of numerous boxes, each containing information. The titles are usually indicated by the first row and first column. 

While every sort of data can be displayed in table form, and with great accuracy, comprehending the data in table form is more complex and time consuming than the other modes, which are all primarily pictorial or graphical in nature.

This part contains questions in which data from common fields such as production is presented in the form of a table over a period of several years: imports, exports, factory employee incomes, students applying for and qualifying for a specific field of study, and so on.

The candidate must first comprehend the provided material before answering the questions based on a comparative examination of the facts.

Tips for Solving Table Chart Problems: 

  1. Carefully read the data, as even the tiniest detail can radically change the meaning of the question.

Similarly, the instructions must be carefully read to avoid wasting time computing data that isn’t required and to determine exactly what the desired solution is.

2.Before answering the questions, make an effort to completely comprehend the information offered. The questions are designed to trick you, so be sure you understand the prerequisites. Try to comprehend the relationship between the given tables if the data is of a mixed kind or if there are multiple data tables/charts/graphs.

One table would discuss absolute sales data, while the other might discuss sales as a percentage of production. As a result, any enquiry about surplus production or goods in stock will necessitate information from both tables.

3. Pay close attention to the units in the tables, as well as the units in which the solutions (options) are given. A typo in the units could result in a completely different result. 

Also, check whether the answer must be in decimal or percentage form. These kind of mistakes are prevalent and easily prevented.

Questions and answers on table reasoning:

Q.1)Look over the table below and answer the questions.

Over the years, the number of candidates who appeared and qualified in a competitive examination from various states has increased?


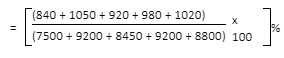
1)What is the proportion of candidates qualified to that of the candidate appeared when the states P and Q are combined in 1998?

A. 10.87%

B. 11.49%

C. 12.35%

D. 12.54%

E. 13.05%

Answer: C

Required percentage

=12.35%

2)What was the average number of candidates from State Q who appeared in the provided years?

A. 8700

B. 8760

C. 8990

D. 8920

E. 8810

Answer: C

Required average.

= 8100+9500+8700+9700+8950 /5

=44950/5

=8990

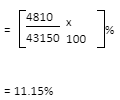
3) What is the proportion of applicants qualified from State N for all years compared to the number of candidates who appeared from State N for all years?

A. 12.36%

B. 12.16%

C. 11.47%

D. 11.15%

None of these

Answer: Option D

Required percentage

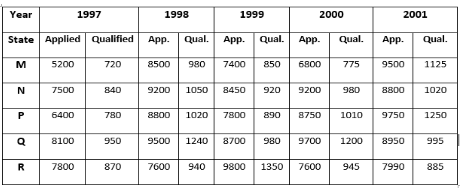
Q.2)A school has four sections W,X,Y and Z of Class IX students.

The results of half sem and annual sem are shown in the table given below.

Result

No. of Students

Section W

Section X

Section Y

Section Z

Students failed in both Sem

28

23

17

27

Students failed in half-sem
but passed in Annual sem

14

12

8

13

Students passed in half-sem
but failed in Annual sem

6

17

9

15

Students passed in both sem

64

55

46

76

1. Which of the following assertions is true in this context if the number of students passing a test is used as a criterion for comparing the difficulty level of two examinations?

A.Half-yearly exams were more challenging.

B.Annual exams were more challenging.

C.The examinations were nearly identical in difficulty.

D.The difficulty levels of the two exams cannot be compared.

E.The annual examinations appear to be more difficult for pupils in Sections A and B than the half-yearly examinations.

Answer: C

Explanation:

Number of students who passed half-sem exams in the school

= (Number of students passed in half-sem but failed in annual exams)
+ (Number of students passed in both sem)

= (6 + 17 + 9 + 15) + (64 + 55 + 46 + 76)

= 288.

Also, Number of students who passed annual sem in the school

= (Number of students failed in half-sem but passed in annual sem)
+ (Number of students passed in both sem)

= (14 + 12 + 8 + 13) + (64 + 55 + 46 + 76)

= 288.

Since, the number of students passed in half-sem= the number of students passed in annual sem.

Therefore, it can be inferred that both the sem had almost the same difficulty level.

Conclusion:

Tables and graphs are effective tools for organising data and making decisions. They can also be used to provide evidence to persuade others to support a particular viewpoint.

Developing arguments and making decisions requires thinking, analysing, and synthesising evidence from many sources.

faq

Frequently asked questions

Get answers to the most common queries related to the CAT Examination Preparation.

What is a table chart's purpose?

Ans. A table chart is a visual representation of data in columns and rows. Tables are frequently used in all methods...Read full

How do you distinguish between a chart and a table?

Ans. A table is a graphical representation of data in symbols such as bars, li...Read full

How crucial are tables in data presentation?

Ans. The proper production of tables allows researchers to display information about tens or hundreds of people effi...Read full

What makes a graph superior to a table?

Ans. They display the overall shape of your data because to their visual chara...Read full

What types of questions can be found in table charts?

Ans. This section contains questions in which data on typical disciplines such...Read full