A Venn diagram is a diagram that depicts the constituents of a set or group. It’s a diagram that depicts all of the logical relationships that can exist between a finite number of sets or groups. A set diagram or logic diagram is another name for it. Multiple overlapping shapes (typically circles) depict sets of various elements in a Venn diagram. Its goal is to create a graphical representation of elements that highlights their similarities and distinctions.
A Venn diagram, is depicted by a rectangle shape around the universal set, which has two independent sets, X and Y, as shown in the diagram above. As a result, the sets X and Y are disjoint. In a circular shape, the two sets, X and Y, are depicted. Sets X and Y have no link to one another in this diagram, but they are both members of a universal set.
Set X = set of even numbers, set Y = set of odd numbers, and Universal set, U = set of natural numbers are some examples. To answer problems based on two sets, we can apply the formula below.
n(X) + n(Y) – n(X Y) = n(X) + n(Y) – n(X Y)
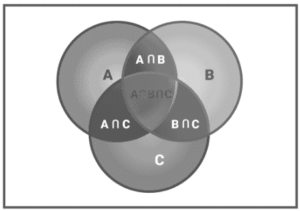
Check out the three-set Venn diagram below.
3 sets of Venn diagrams
The following is the formula for solving problems on Venn diagrams with three sets:
n(A) + n(B) + n(C) – n(A B) – n(B C) – n(A C) + n(A B C) + n(A B C) + n(A B C)
The following symbols are used to represent set operations:
The symbol for set union: Symbol for set intersection:
Set complement: A’ or Ac
To draw a Venn diagram, you must first understand the universal set. Each set is now a subset of the universal set (U). Every other set will be contained within the rectangle that represents the universal set.
As a result, any set A (shaded region) will look like this:
Figure 1:
U stands for universal set.
From Figure 1, we may deduce that
A ∪ U = U
The circle contains all of set A’s elements. They are also elements of set U because they are part of the large rectangle.
Many operations on sets are performed in set theory, including:
Set Combination
Set’s intersection
Set’s complement
Set differences, for example. The following are the representations of several operations on a set:
In Venn Diagram A’, the complement of set A is the complement of set A. (represented by the shaded region in fig. 2). This set includes all of the items not found in set A.
Figure 2:
Set A’s complement
It is evident from the diagram above that
A + A’ = U
It signifies that the set generated by combining the members of sets A and A’ equals U.
(A’)’= A
A complement set’s complement is also a set.
Set’s Complement Properties:
A ∪ A′ = U
A A′ = (A B)′ = A′ B′ (A B)′ = A′ B′ (A B)′ = A′ B′
U′ = φ φ′ = U
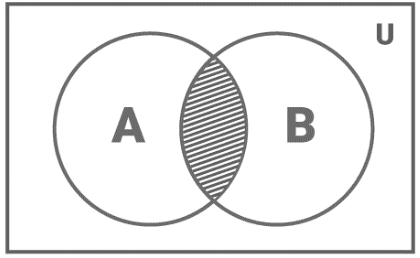
In a Venn Diagram A intersection B, the intersection of two sets is given by: A B = x: x A and x B.
This reflects the elements that are shared by sets A and B. (represented by the shaded region in fig. 3).
Figure 3:
A crossroads B
The intersection of sets operation has the following properties:
A ∩ B = B ∩ A (A ∩ B) ∩ C = A ∩ (B ∩ C)
φ ∩ A = φ ; U ∩ A = A
A A = A A (B C) = (A B) (A C) = (A B) (A C)
A ∪ (B ∩ C) = (A ∪ B) ∩ (A ∪ C)
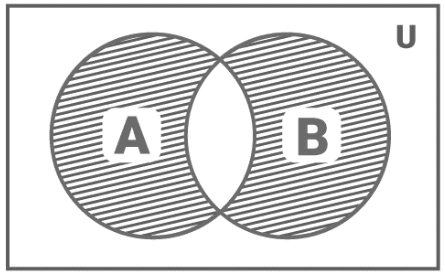
In a Venn Diagram, two sets are joined together.
A B = x | x A or x B is the formula for a union B.
This reflects the elements of sets A and B combined (represented by the shaded region in fig. 4).
Figure 4:
A union B
Some characteristics of Union operations include:
A ∪ B = B ∪ A
(A ∪ B) ∪ C = A ∪ (B ∪ C)
A ∪ φ = A
A ∪ A = A
U ∪ A = U
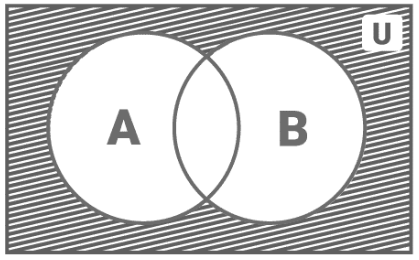
In a Venn Diagram (A B), the complement of the union of sets is: This is viewed as A union B’s complement. This symbolises elements that do not belong in either set A or set B. (represented by the shaded region in fig. 5).
Figure 5:
A union B’s complement of sets
A U B’s complement
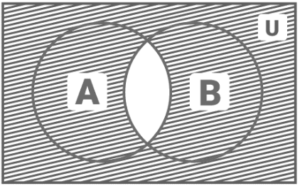
In a Venn Diagram (A B), the complement of the intersection of sets is: This is viewed as A intersection B’s complement. This illustrates universal set elements that are not shared by sets A and B. (represented by the shaded region in fig. 6).
Figure 6:
A B’s complementary
In Venn Diagram A – B, the difference between two sets is: This is written as A distinction B. It’s also called ‘relative complement’ on occasion. This indicates set A items that are not present in set B. (represented by the shaded region in fig. 7).
Figure 7:
A Distinction B
In Venn Diagram A and B, the symmetric difference between two sets is: This can be understood as a symmetric difference between sets A and B. This is a set that contains components that belong to either set A or set B but not both (represented by the shaded region in fig. 8).
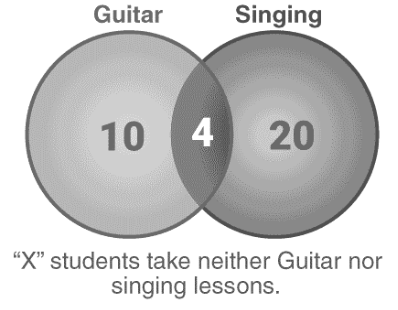
In a class of 50 students, 10 students take guitar lessons, 20 students take singing lessons, and four students do both. Determine how many pupils do not take guitar or singing classes.
Solution
Let A equal the number of students who take guitar lessons.
Let B equal the number of students who take singing lessons, which is 20.
Let C equal the number of students who are taking both classes.
The value of C is now subtracted from both A and B. Allow new values to be saved in D and E.
Therefore,
D = 10 – 4 = 6
E = 20 – 4 = 16
Now, logically, adding the values of C, D, E, and the unknown quantity “X” should result in a total of 50, correct? That’s right.
X = 50 – C – D – E is the final answer.
X = 50 – 4 – 6 – 16
X = 24 [Answer]
The Venn diagram depicts the similarities and contrasts between the two quantities to aid in the decision-making process. Venn diagrams are visual representations of mathematical set theory principles. They highlight logical links between distinct groupings of sets using Venn diagram symbols. Nonetheless, the Venn diagram’s streamlined aim of illustrating concepts and groups has led to its widespread use in a variety of sectors, including statistics, linguistics, logic, education, computer science, and commerce.
 Profile
 Settings
 Refer your friends
 Sign out