A position-time graph is aplot of position versus time, showing the relation of the positions of an object with the passage of time. However, it may not show the trajectory of movement to those positions. In physics, position-time graphs describe the velocity of a particle in time and space. They are used to describe the motion of a particle in a space, but they can be used for any motion.
Calculation of velocity from a position-time graph
The average velocity of an object can be calculated from the position-time graph with a constant slope. The average velocity is given by the total change in position divided by the total change in time.
V = ∆D ⁄ ∆T
We can find the velocity because of the presence of a constant slope indicating constant or positive velocity and no acceleration. We can directly calculate the slope by applying the rules of trigonometry. The value obtained will give us the value of velocity.
Uses of position-time graphs
Position-time graphs are useful in the following ways:
They help in the detection of the motion of an object in various instances.
It helps in the calculation of average velocity.
A position-time graph can be used for the analysis of stock price, for example, or for forecasting future market activity, etc.
It can be used to find relationships between two data sets (for example, time and years of education).
We can visualise the path of the object using these graphs and calculate the maximum velocity of the particle by obtaining the value of the steep slope point of the slope.
Types of x-t graphs that are possible
On X-axis, time is marked, and on the Y-axis, displacement is marked.
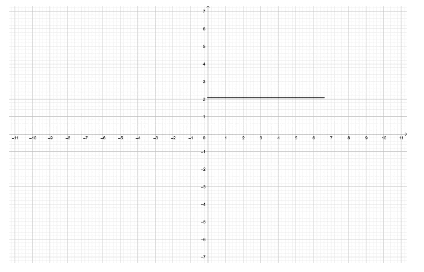
(1).The position of the particle is fixed with respect to time. This means the body is at rest.
Slope = ⅆx ⁄ ⅆt =0
So, particle has no velocity
For example, if a body is kept at a location and its position does not change with respect to time, then the body will be at rest. So, the plot of a graph between position and time will be a straight line parallel to the time axis. Considering the x-axis is the time axis, the graph that can be observed is:
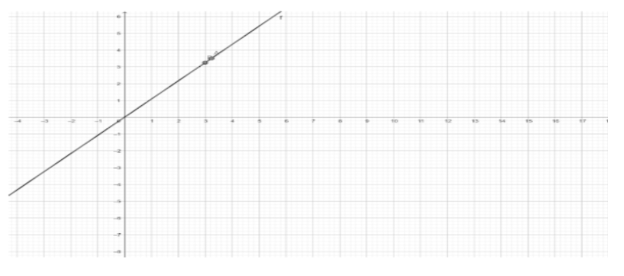
(2).The slope of the straight line is a fixed (constant) value. So, the particle is in uniform motion, and the velocity can be determined by
V =slope = ⅆx ⁄ ⅆt = constant
In the case of a negative slope, it indicates the particle is moving in the negative x-axis direction.
For example, suppose a runner is running at a constant speed of 2m/sec, then it means the runner will cover a distance of 2m in each one sec. So, the position is changing linearly, which is why the graph is a straight line having a fixed slope of 2.
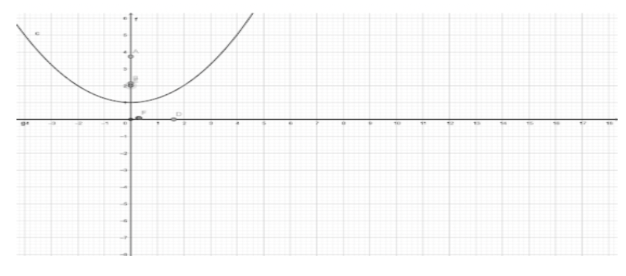
(3).In the following graph, at x =0, the slope is zero, and so is the velocity. At x=4, there is a positive slope. So, the velocity is changing.
For example, if a ball is thrown up into the sky, its position will change non-linearly.
And the portion of the graph after the origin should lie in the first quadrant, in the first half of the throw, that is, when the ball reaches the highest point.
Features of a position-time graph
This graph tells the distance travelled by a body starting from its starting point.
The straight line obtained in the graph after marking all the points gives the velocity of the object.
If the slope is positive, it means its velocity is increasing—the more the slope, the greater the velocity.
A horizontal straight line in the graph indicates a constant velocity which means that the position of the object is not changing.
Position-time graph tells us about the motion of an object at different instances.
Conclusion
A position-time graph is a graph that shows the changes in the values of a variable over time. Time is usually represented on the vertical axis, and the values are on the horizontal axis of a position-time graph. When an object is moving in a uniform motion, then the objects travel an equal distance in equal intervals of time. So, for the object moving in uniform motion, then its position-time graph will be a straight line with respect to the time axis. We can use a position-time graph to help us understand the motion of an object.



 Profile
 Settings
 Refer your friends
 Sign out