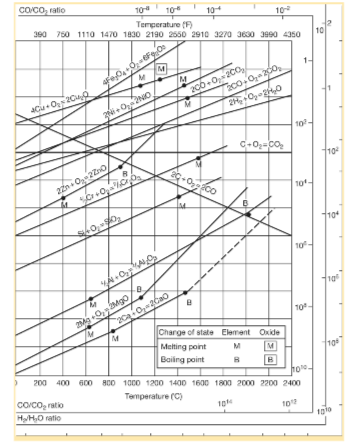
The Ellingham diagram is a graph that shows how the stability of a compound is temperature dependent. It was created by a British physical chemist named Harold Johann Thomas Ellingham in 1944. The Ellingham diagram is extremely useful in metallurgy. It helps predict the equilibrium temperature between a metal, its oxide and its reactions with nonmetals like sulphur and nitrogen. It is also key in extractive metallurgy, i.e., the separation of valuable metals from their ores. From the graph, we can estimate the tendency to reduce a metal’s oxides and sulphides.
A graphical representation of the Ellingham diagram is shown below.
G = H – TS, where
The Ellingham Diagram cannot provide reliable information under certain circumstances.
G = -RTlnK, where
R is the universal gas constant
The graph assumes that all reactants and products are present at equilibrium, which is not always true.
From the Ellingham Diagram, we can analyse the reduction tendency of metals with respect to other metal oxides and oxygen. These graphs are extremely useful for many real-world applications like the extraction and purification of steel and other metals. Though it has several limitations, the graph is an extremely useful tool in extractive metallurgy.



 Profile
 Settings
 Refer your friends
 Sign out


