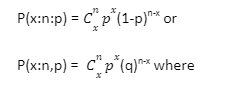
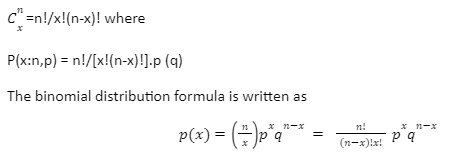
The binomial distribution, which predicts the odds of obtaining one of two outcomes given a set of parameters, is an example of a typical probability distribution. It is a summary of the number of trials that were done with the same chance of attaining a particular outcome as the others. The value of a binomial may be calculated by multiplying the number of independent trials by the number of successes.
n- getting number of the head is given as
n(x) = 0,1 or 2 head is the binomial random variable
Here, the probability of occurrence of the head is distributed.
No of heads (n(X)) | Probability of getting ahead(P(X)) |
Zero head (x=0) | P( x is zero)=1/4 = 0.25 |
one head (x=1) | P( x is one [head tail]) =1/4 + 1/4 = 0.5 |
Two head (x=2) | P( x is two [head]) =1/4 = 0. 25 |
The above table shows the probability of getting one head in the single flip of two coins is 1/2. If we toss the three-coin, then there might be eight possible outcomes like
Consider the occurrence of the head as success. Then
n- getting number of head is given as
n(x) = 0,1, 2or 3 is the binomial random variable
Hre is an example of a clear understanding of negative binomial distribution.
Suppose throw dice the occurrence of all three is considered as the failure and non-3’s are Success ‘r’ is the letter used to demonstrate failure.
If the dice are thrown frequently until 3 appears four-time, which means r = four failures, then the binomial distribution of the number non-3’s that arrived would be the negative binomial distribution.
The binomial distribution formula is given by
X- random variable and it is given by
where p – the probability of success
q – is the probability of success
n – number of trails
The binomial distribution is written as
where
For example
P(X=x) where
Here are some of the conditions of the Bernoulli trials that are listed below
Here are important formulas related to Bernoulli trials
P(X=1) = p,
P(x=0) = 1-p = q
2) In a binomial experiment, X is the number of successes then
n- independent trail
p(X=k) =
where
3) the PMF(probability mass function) for Bernoulli distribution where n=1
y – random variable
p – is success probability
f(y, p) = {p, if y = 1 and q = 1- p, if y = 0}
OR
f(y, p) = py (1 – p)1-z, for y = 0, 1
4) If Y is the Bernoulli random variable, then the expected value(mean) is
E(Y) = p
5) If Y is the Bernoulli random variable, then the variance is
Var[Y] = p(1-p) = pq
The binomial distribution is used in statistics as a building component for dichotomous variables, such as the likelihood that either candidate A or B would emerge in position one on the midterm exams, which are dichotomous variables. It also represents the probability of an event happening, provided the given criteria are met. If you wish to use the binomial probability formula, you must first understand the binomial distribution. These regulations must be observed at all times throughout the operation.


 Profile
 Settings
 Refer your friends
 Sign out