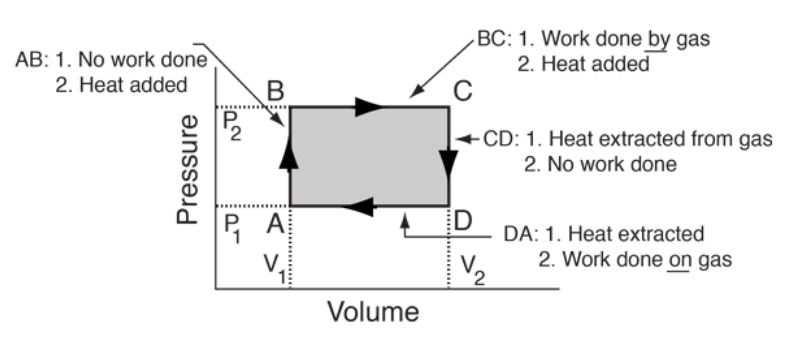
A heat engine is a device used to convert thermal energy to mechanical energy. The pressure-volume (PV) diagram describes the process occurring in heat engines at the constant mass of gas. A PV diagram is represented as a closed loop. The closed loop is the amount of work done during a cycle.
In a PV diagram, volume is depicted on the horizontal axis and pressure on the vertical axis, as seen in the above figure. Each point of the PV diagram represents states of different stages of gas. The closed loop represents each state of gas and work done during the cycle.
Internal energy and temperature are directly proportional if there is no gaseous escape. Temperature and internal energy will increase if pressure or volume increases. If the PV diagram moves upwards, the internal energy is increasing and vice versa.
When the piston moves downwards, the volume of gas is decreasing, which means the work done is positive. When the piston in the cylinder moves upwards, the gas inside the cylinder will expand and the volume will increase, which means the work done is negative.
So, we can conclude that the right side of the PV diagram indicates that work done is negative, while the left side indicates that work done is positive.
We can decide the magnitude of heat transfer from the PV diagram.
According to the first law of thermodynamics,
Q = ΔU-W
Where,
Q: Heat transferred
Δ U: Change in internal energy
W: Work done
Q = (+) – (-)
So, if the change in internal energy is positive and the work done is negative, we can say that heat transferred is positive, which means more heat is transferred.
Heat engine efficiency is defined as the ratio of work done by the machine to the energy absorbed at a higher temperature.
Heat engine efficiency, η= Work done/Work input.
A heat engine has various thermal processes.
In the isothermal process, the system’s temperature remains constant despite heat transfer.
In the adiabatic process, there is no heat transfer but the system’s temperature remains constant (Q = 0).
In the isobaric process, the system’s pressure remains constant during the compression or expansion process.
In the isovolumetric process, the system’s volume remains constant. This is also known as the isochoric process (w = 0).
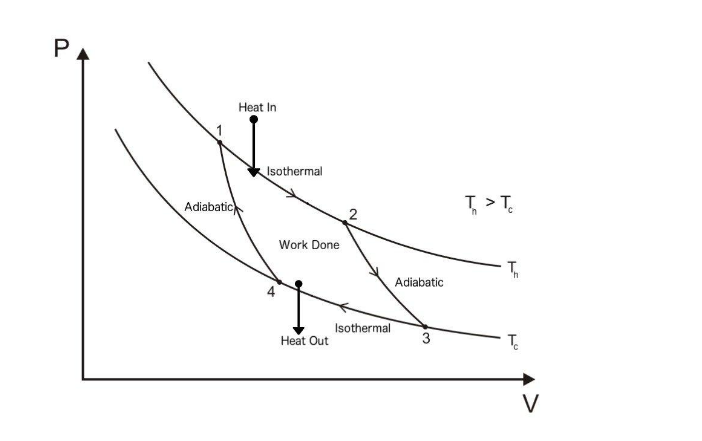
Below is the PV diagram of Carnot’s heat engine.
Carnot’s PV cycles have four stages as follows:
Ideal gas in the cylinder or within the high-temperature reservoir will absorb heat from the heat source, which leads to moving upwards in the piston; thus, gas expansion will occur. This is shown in parts 1 and 2.
The base is thermally insulated, which means heat cannot enter or leave the system, as shown in parts 2 and 3.
The surroundings work on the gas and expel energy “Q”, shown in parts 3 and 4.
The process in a thermally insulated chamber will compress the gas and increase its temperature, shown in parts 4 to 1.
A PV diagram is used to describe gas states at each stage of the heat engine working cycle. A PV diagram illustrates the process occurring in heat engines at the constant mass of gas. A PV diagram is in a closed loop, representing the amount of work done during a cycle.
A PV diagram depicts volume on the horizontal axis and pressure on the vertical axis. Each point of the PV diagram represents states of different stages of gas.



 Profile
 Settings
 Refer your friends
 Sign out