Access free live classes and tests on the app
Download
+
Unacademy
  • Goals
    • AFCAT
    • AP EAMCET
    • Bank Exam
    • BPSC
    • CA Foundation
    • CAPF
    • CAT
    • CBSE Class 11
    • CBSE Class 12
    • CDS
    • CLAT
    • CSIR UGC
    • GATE
    • IIT JAM
    • JEE
    • Karnataka CET
    • Karnataka PSC
    • Kerala PSC
    • MHT CET
    • MPPSC
    • NDA
    • NEET PG
    • NEET UG
    • NTA UGC
    • Railway Exam
    • SSC
    • TS EAMCET
    • UPSC
    • WBPSC
    • CFA
Login Join for Free
avtar
  • ProfileProfile
  • Settings Settings
  • Refer your friendsRefer your friends
  • Sign outSign out
  • Terms & conditions
  • •
  • Privacy policy
  • About
  • •
  • Careers
  • •
  • Blog

© 2023 Sorting Hat Technologies Pvt Ltd

JEE Main 2026 Preparation: Question Papers, Solutions, Mock Tests & Strategy Unacademy » JEE Study Material » Mathematics » Mode Deviation for Grouped and Ungrouped Data

Mode Deviation for Grouped and Ungrouped Data

In this article we will cover what is mode deviation, Formula for Mode, How to calculate the mode deviation for both grouped and ungrouped data, Examples of mode deviation. The number that appears most frequently in a set of data is called the mode. By counting the occurrences of each value in a data collection, we may determine the mode.

Share

One of the values of the measures of central tendency is the mode. This number gives us a general notion of which data set elements are most likely to occur. For instance, we are aware that a college offers 10 different course options to its students. The course with the greatest number of student registrations will now be used as the method of our provided data out of these number of students taking each course. Overall, the mode provides information on the item in the data set that occurs the most frequently.

Finding the mean or median won’t help you locate the course with the most students enrolled in it. So, under these circumstances, we frequently use Mode. 

We will go over how to determine the mode of both grouped and ungrouped data in this article.

What is Mode Deviation?

A value or number that appears most frequently in a dataset is referred to as the mode. We might occasionally need to identify the value that appears more frequently in the dataset. In these situations, we determine the mode for the given collection of data. 

Formula for Mode

The mode or modal value of a given collection of data is determined using the mode formula in statistics. It is characterized as the value that consistently appears in a particular set. 

How to Calculate the Mode Deviation for  Grouped and Ungrouped Data 

We are aware that a set of data’s mode refers to the value that appears the most frequently. The approach to finding the mode can now be modified based on the provided data (grouped or ungrouped). 

Mode deviation for grouped data

Use the methods listed below to determine the mode for grouped data.

  • Find the class interval with the highest frequency as the first step. Modal class is another name for this
  • Determine the class size. By deducting the upper limit from the lower limit, this is computed
  • By Using the formula of mode , determine the mode

Where,

L is the modal class’s lower limit, 

h is the class interval’s size, 

fm is the frequency of the modal class, 

f1 is the frequency of the modal class’s predecessor class.

f2 is the frequency of the modal class’s successor class.

Mode deviation for Ungrouped Data Mode

Ungrouped data refers to data that does not appear in groupings.

Simply arrange the data values either in ascending or descending order, then look for the repeated values and their frequency to determine the mode for ungrouped data. The modal value for the provided data is here defined as the observation having the highest frequency.

Examples of Mode Deviation

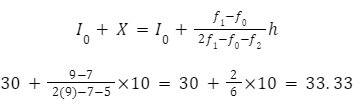
1. For the class interval and frequency listed in the table, determine the mode for the grouped data.

Solution:

Class interval

frequency

10-20

5

20-30

7.

30-40

9

40-50

5

50-60

4

Maximum class frequency is 9 so ƒm orƒ1=9

Class interval corresponding = 30-40

Modal class lower limit (I) = 30

Size class interval (h) =10

The frequency of the class before the modal class (ƒ0) = 7, and the frequency of the class after the modal class (ƒ2) = 5

Using these numbers as replacements in the mode formula

Answer: mode = 33.33


  1. From the following table, determine the mode of the ungrouped data.

Solution:

Color of car

Red 

Blue 

Silver 

Black 

Yellow 

No. of car solid

10

12

20

15

11

We will look at the class with the highest frequency to determine the mode of the ungrouped data. The most common class of vehicle in this instance is one that is “Silver” in color. Therefore, 20 is the mode.

 Answer: mode  =20

Conclusion

In this article we learned that the value(s) that appear in a dataset the most frequently are represented by the mode. When the mean and median cannot be employed, the mode informs us of the most prevalent value in categorical data. The mode provides us with a sense of where the “center” of a dataset is, although it is less reliable than the mean or median.

faq

Frequently asked questions

Get answers to the most common queries related to the JEE Examination Preparation.

Define the Mode in Statistics?

Answer- The value that recurs frequently in a particular set is the definition of mode. It is one of the three measu...Read full

How do grouped data define mode?

Answer- The number that appears most frequently in a set of data is called the mode. By counting the occurrences of ...Read full

If there are no repeating numbers, what is the mode?

Answer- No number can be referred to as a mode if there are no recurring numbers in the list. In these situations, z...Read full

What is the mode formula for data that are not grouped?

Answer- We must identify the observation that emerges most frequently in ungrouped data. Mode is the highest frequen...Read full

What is the statistical formula for mode?

Answer- There is no mode at all for data without any repeated values. The given dataset determines the mode value. T...Read full

Answer- The value that recurs frequently in a particular set is the definition of mode. It is one of the three measures of central tendency, along with mean and median. In other words, the value or number in a data collection that occurs more frequently or with a higher frequency is the mode or modal value.

Answer- The number that appears most frequently in a set of data is called the mode. By counting the occurrences of each value in a data collection, we may determine the mode.

Answer- No number can be referred to as a mode if there are no recurring numbers in the list. In these situations, zero modes are discovered for the provided data set.

Answer- We must identify the observation that emerges most frequently in ungrouped data. Mode is the highest frequency of observation.

Answer- There is no mode at all for data without any repeated values. The given dataset determines the mode value. The following mode formula is used to determine the mode for grouped data.

IIT JEE - Rank Predictor
IIT JEE - Ask a Doubt

Trending topics

  • JEE Notification
  • JEE Question Paper
  • JEE Exam Pattern
  • JEE Admit Card
  • JEE Main Eligibility

Related links

  • Difference Between Acid Radical and Basic Radical
  • Swarts Reaction
  • Focal length of Convex Lens
  • Root mean square velocities
  • Fehling’s solution
IIT JEE free live classes
Subscribe Now
.
Company Logo

Unacademy is India’s largest online learning platform. Download our apps to start learning


Starting your preparation?

Call us and we will answer all your questions about learning on Unacademy

Call +91 8585858585

Company
About usShikshodayaCareers
we're hiring
BlogsPrivacy PolicyTerms and Conditions
Help & support
User GuidelinesSite MapRefund PolicyTakedown PolicyGrievance Redressal
Products
Learner appLearner appEducator appEducator appParent appParent app
Popular goals
IIT JEEUPSCSSCCSIR UGC NETNEET UG
Trending exams
GATECATCANTA UGC NETBank Exams
Study material
UPSC Study MaterialNEET UG Study MaterialCA Foundation Study MaterialJEE Study MaterialSSC Study Material

© 2026 Sorting Hat Technologies Pvt Ltd

Unacademy
  • Goals
    • AFCAT
    • AP EAMCET
    • Bank Exam
    • BPSC
    • CA Foundation
    • CAPF
    • CAT
    • CBSE Class 11
    • CBSE Class 12
    • CDS
    • CLAT
    • CSIR UGC
    • GATE
    • IIT JAM
    • JEE
    • Karnataka CET
    • Karnataka PSC
    • Kerala PSC
    • MHT CET
    • MPPSC
    • NDA
    • NEET PG
    • NEET UG
    • NTA UGC
    • Railway Exam
    • SSC
    • TS EAMCET
    • UPSC
    • WBPSC
    • CFA

Share via

COPY