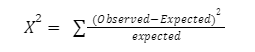
A statistical approach for determining the difference between observed and predicted data is the Chi-Square test. This test can also be performed to see if it corresponds with our data’s categorical variables. It can be used to determine whether a discrepancy between two category variables is due to chance or is the result of a relationship.
The observations are divided into mutually exclusive types in normal uses of this test. The test statistic generated from the observations follows a X2 frequency distribution if the null hypothesis states that there are no differences in the population between the classes. The test’s goal is to determine how likely the observed frequencies are if the null hypothesis is correct.
Chi-square is a statistical test that examines the differences between categorical variables from a random sample in order to determine if the expected and actual results are well-fitting.
The number of variables that can change in a statistical calculation is represented by degrees of freedom. To verify that chi-square tests are statistically valid, the degrees of freedom can be determined. These tests are widely used to compare observed data with data that would be predicted if a certain hypothesis were correct.
Degrees of Freedom: The number of degrees of freedom does not necessitate any complicated computations. To reduce the number of levels in our category variable, simply subtract one. We’ll use this number to determine which of the infinite chi-square distributions to use.
The observed values are those that you have gathered on your own.
Based on the null hypothesis, the predicted values are the expected values.
We produced a chi-square statistic that corresponds to a specific point on a chi-square distribution with the proper amount of degrees of freedom. If the null hypothesis is true, the p-value determines the likelihood of getting a test statistic this extreme. The p-value of our hypothesis test can be calculated using a table of values for a chi-square distribution. If we have statistical software, we can utilize it to get a more accurate estimate of the p-value.
Chi-square test p-value interpretation
The p-value in a chi-square analysis is the probability of getting a chi-square as large as or larger than that in the current trial while still having the data support the hypothesis. It’s the likelihood that variations from the expected are due to chance.
A chi-square test is used to see if observed results match expected results and to rule out the possibility that observations are random. When the data being studied is from a random sample and the variable in question is a categorical variable, a chi-square test is applicable. A categorical variable includes options such as automobile kind, race, educational achievement, male vs. female, and how much someone likes a political candidate among others.
Difference between Chi square test vs f test given below-
The p-value in a chi-square analysis is the probability of getting a chi-square as large as or larger than that in the current trial while still having the data support the hypothesis. It’s the likelihood that variations from the expected are due to chance.
By assuming that the null hypothesis is true, the chi-square test is used to determine how likely the observations are. A hypothesis is a possibility that a certain condition or statement is true, which we can test later.
The chi-square test is used to determine whether observed results match expected results and to rule out the possibility of random observations. A chi-square test is appropriate when the data being analyzed is from a random sample and the variable in issue is a categorical variable. Options such as automobile type, race, educational achievement, male vs. female, and how much someone loves a political candidate (from very much to very little) are examples of categorical variables.



 Profile
 Settings
 Refer your friends
 Sign out