In statistics, the standard deviation is the degree of distribution or scatter of data points which is relative to the mean. It tells us the distribution of values over the sample and is a measure of the data points’ deviation from the mean. The square root of the variance is the standard deviation of a random sample of data collection.
Let us learn the standard deviation meaning in detail:
The square root of the variance is known as the standard deviation. It’s a metric for how far data deviates from the average.
The range is a useful statistic, since the data at the top and bottom represent the discoveries that are the farthest afield from the generality. They do not, however, provide much information on the spread of observations around the mean. The standard deviation (SD) comes into play here.
The standard deviation’s theoretical foundation is complicated, but it shouldn’t bother the average user. A practical point to keep in mind is that when the data come from a population with a distribution that is roughly “normal” (or Gaussian), the standard deviation can be used to interpret the data in terms of probability.
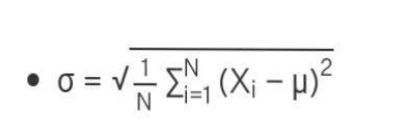
Standard deviation can be calculated with the help of the following formula:
σ = Population standard deviation
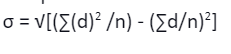
μ = Assumed mean
The standard deviation is a measure of how far each observation deviates from the mean. If the discrepancies were added together, the positive would perfectly balance the negative, resulting in a sum of zero.
As a result, the squares of the differences are added together.
The mean of the squares is then calculated by dividing the total of the squares by the number of observations minus one, and the square root is used to convert the data back to the units we started with. (To get the mean square, divide by the number of observations minus one rather than the number of observations itself, since “degrees of freedom” must be utilised.) They are one less than the total in these cases.
(In practice, the theoretical explanation for this need not be a bother.)
Consider picking candy from a box of n candies to get a sense of degrees of freedom. We have an option every time we come to choose a candy until we get to the last one, at which point we have no choice. As a result, we have n-1 options, or “degrees of freedom.”
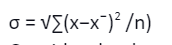
Standard deviation estimates differ depending on the data. The distribution measures the deviation of data from its mean or average position. The standard deviation can be calculated in two ways.
Consider the data points 3, 2, 5, and 6. The average of these data points is 16/4 = 4 in this case.
The squared deviations from the mean = ((4-3)^2+(2-4)^2 + (5-4)^2 + (6-4)^2 )=10
Variance = squared deviations from the mean divided by the number of data points =10/4 =2.5
The standard deviation is √2.5, which equals 1.58.
When the x values are large, the mean is set to an arbitrary number (A). d = x – A is used to compute the deviation from the assumed mean.
To summarise, we would say that in distribution, the standard deviation has been the most significant tool for measuring dispersion. The square root of the mathematical mean of the squares of departures of observations from their mean value is the standard deviation. It is usually symbolised by the letter sigma, i.e., Both grouped and ungrouped data are significant in their way. The standard deviation for ungrouped data can be taken out by two methods, namely, the actual mean method and the mean method assumption.


 Profile
 Settings
 Refer your friends
 Sign out