Trigonometric functions are the primary six functions having a domain input value of the angle of a right triangle and a numeric answer as the range. We can work on the domain of the trigonometric function f (x) = sinx, which is the angle represented in degrees or radians with a range of [-1, 1]. Likewise, we have fields and dimensions for all other functions. We use these graphs in many areas of engineering and science. A few examples are the growth of animals and plants, engines, and waves. Besides, we can prepare the graphs for all trigonometric functions. With the aid of the corresponding visual presentation, you may rapidly understand the graphical representations of sine, cosine, and tangent functions. Pupils can learn how to sketch trigonometric functions that are useful to their field of study.
We know that sine, cosine, and tangent are the three vital trigonometry ratios based on which functions are defined. Below are some graphs of the three trigonometric functions: sin x, cos x, and tan x. The x-axis values of the angles in these trigonometry graphs are in radians, and the y-axis value of the function at each given angle is f (x).
We can explain the sine trigonometric functions.
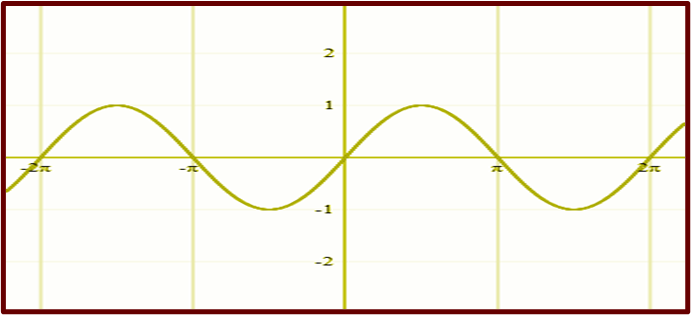
The following is a presentation of a sine graph.
We have values based on trigonometric principles:
The maximum value of the graph | The minimum value of the graph |
1 at π/2 | -1 at (3π/2) |
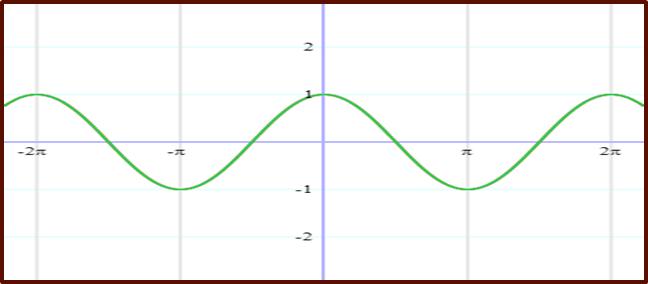
We can explain the cosine trigonometric functions. We have values based on trigonometric principles.
Presentation of a Cosine Graph, as mentioned below
The maximum value of the graph | The minimum value of the graph |
1 at 0 | -1 at 3π/2 |
We can note here that there are a few analogies between the sine and cosine graphs; they are:
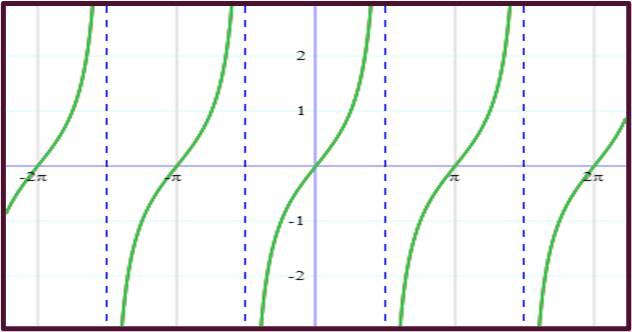
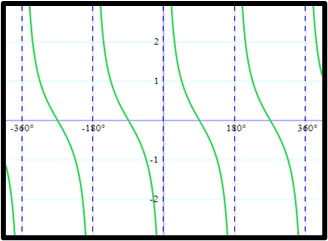
The tan function isn’t the same as the sine or cosine functions. Throughout π Radian, the work between negative and positive infinity crosses via 0.
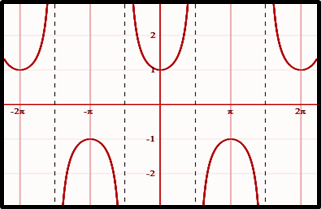
The graph below displays a domain value of x on the horizontal x-axis. The same presentation has a range of vertical y-axis in trigonometric function graphs. We note that Sin X and Tan X have graphs that pass through the origin, while other trigonometric functions do not have graphics that go through the start. It is worth noting here that the Sine and Cosine functions in trigonometry have a defined range of [-1, 1].
Cosec (X) ⬆
COT (X) ⬆
SEC (X)
You can sketch trigonometric graphs for all trigonometry functions if you know the following.
Amplitude
Period
Phase
The raised terms are also vital for use in the graph of trigonometry formulas
We have different methods for drawing the graph of a trigonometric function. A detailed explanation of one of the efficient methods is below. You can sketch a graph of the sine function. First, convert the objective given to the general form as a sin (bx – c) + d to find the different parameters such as amplitude, phase shift, vertical shift, and period.
Where,
Consequently, we may use the cos (bx – c) + d to calculate the cosine function
Example number 1:
Graphing Trig Functions Practice.
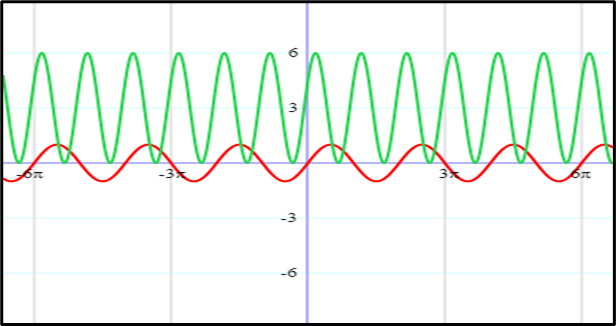
y=3sin(2x+ π6) +3
This means y=3sin(2x+π6) +3
From the equation, we realise that,
Hence Graphical presentation of y=3sin(2x+π6) +3
will be as mentioned below,
Graphical presentation of the equation y=3sin(2x+π6) +3
will be as above. ⬆
Example number 2:
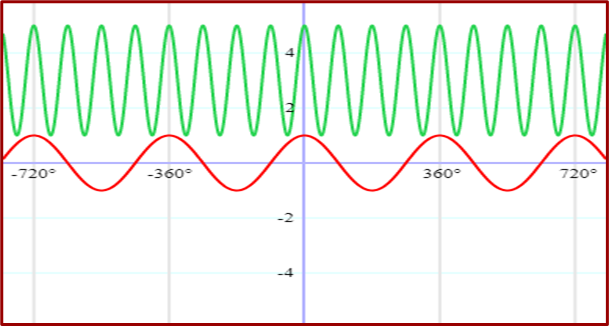
We can also calculate the cosine in degrees. Let the equation y=2cos (4x -2π)+3
Graphical presentation of the equation 2cos (4x -2π)+3 will be as above. ⬆
We quantify the domain of trigonometric operations in degrees or radians. We design the table below that has the most significant trigonometric function values. We refer to these variables as “standard values,” and we must use them frequently in our computations. Many mathematicians and statisticians use the principal utility of the table.


 Profile
 Settings
 Refer your friends
 Sign out