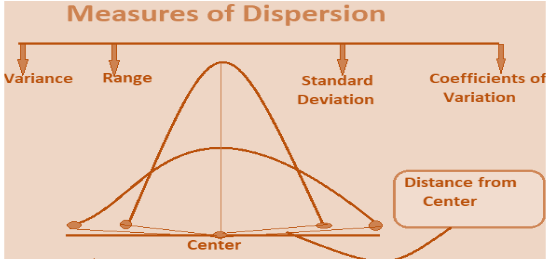
The central tendency measures are insufficient to describe data. The mean of two data sets can be the same, but they can be completely different. To describe data, one must first understand the degree of variability. The three most common measures of dispersion are range, interquartile range, and standard deviation. The term “dispersion” refers to the degree to which a set of data is dispersed. When all the data is the same, the measure of dispersion is zero, and it rises as the data becomes more varied. Dispersion measures determine whether the scattered data is homogeneous or heterogeneous. It also refers to the differences between data sets.
“In statistics, dispersion refers to the degree to which a distribution is stretched or squeezed. Dispersion differs from location or central tendency, and the two together are one of the most commonly used properties of distributions.”
Dispersion measures aid in describing data variability. Data dispersion is a statistical term that describes the degree to which data is dispersed. Measures of dispersion are thus specific types of measures used to quantify data dispersion.
Figure 1
The following are the most common statistical dispersion measures:
The Measure of Dispersion in Statistics is divided into two categories, each with its own set of methods for measuring the various types of data. Its primary application is in biological statistics. We can quickly classify them by determining whether or not they contain units.
We can categorizes the information into two groups:
Absolute Measures of Dispersion – Absolute Dispersion Measures is a dataset with units; it uses the same unit as the original dataset. The average of dispersion quantities such as Standard or Mean deviation is used to calculate the absolute measure of dispersion. The Absolute Measure of Dispersion can be expressed in a variety of units, including rupees, centimeters, marks, kilograms, and other weights and measures.
In statistics, there are several different types of absolute measures of dispersion:
Example: 1,2,3,4,5,6,7 Range = Highest value – Lowest value = (7 – 1) = 6
Example: 1,2,3,4,5,6,7,8 = Mean = (sum of all terms divided by total number of terms) = (1 + 2 + 3 + 4 + 5 + 6 + 7 + 8) / 8 = 36 / 8 = 4.5
(σ2) = ∑ ( X – μ)2 / N
Standard Deviation = √σ
Relative measures of dispersion: In statistics, relative measures of dispersion are values without units. When comparing the distribution of two or more datasets, a relative measure of dispersion is used.
σ = ( √( X – X1)) / (N – 1)
Deviation = ( X – X1) , σ = standard deviation , N= total number
(Q3 – Q3) / (Q3 + Q1), Upper Quartile (Q3) ,Lower Quartile (Q1)
Mean Deviation using Mean: ∑ | X – M | / N
Mean Deviation using Mean: ∑ | X – X1 | / N
In statistics Dispersion refers to the measure of the variability of data or terms. Like variability may give random measurement errors where some of the instrumental measurements are found to be imprecise. Understanding dispersion is important for understanding statistics. It aids comprehension of concepts such as data diversification, data spread, data maintenance, and data maintenance over the central value or central tendency. Furthermore, statistical dispersion recognize us to gain a better understanding of data distribution.


 Profile
 Settings
 Refer your friends
 Sign out